Autodesk recently showcased Tandem’s new dashboarding capabilities for obtaining all sorts of metrics from digital twins. This is the latest in a long line of updates which are coming thick and fast. Martyn Day reports
In 2015, Autodesk launched its cloud-based development API, Forge. Forge was a set of tools and services for building cloud-based software applications, with integrations to all the main Autodesk products.
For some unknown reason, Autodesk recently renamed Forge to the less impressive Autodesk Platform Services (APS), but the capabilities have remained unchanged.
The key aim is to expedite the development of new applications from these core Autodesk building blocks, such as DWG, viewers, file exchangers etc. If there was a poster child as to the benefits of ‘APS’, it is the digital twin solution Autodesk Tandem, launched in 2021, which is still being rapidly developed in front of our very eyes.
The initial release was very bare bones. It didn’t support IFC and was pretty much a place to ‘lightweight’ Revit BIM models and start renaming and filtering sets of building components for more complex capabilities yet to come.
Since then, Autodesk has continually added sizable chunks of workflow-centric capabilities every couple of months. Given so many models are in RVT format, Tandem could be the tool to bring digital twins to the masses.
Just looking at the last six months, it’s clear the Tandem team is on a mission. In January, Autodesk included the facility monitoring beta program, which enabled Tandem to display near real time IoT data. It was also looking to spot anomalies ahead of equipment failures. This is the most exciting technology for me, as it connects the digital twin database with the physical reality of operations.
In April, the new ‘Systems’ feature was released, which uses system tracing to identify and filter routed systems like MEP, which might be imported as just a bunch of individual components with no ‘intelligence’ associated. It also included new facility monitoring visualisations and heatmapping capabilities.
Now, this month comes dashboards, which you might think is very much at the test and consumption end of the digital twin process. However, Autodesk’s first dashboard offering is very specifically aimed at using dashboards to check the completeness of the twin data.
In the demo, dashboards worked off the facility template, which is a place where components get classified and tagged for tracking in Tandem. These can be assets, systems or subsystems, by discipline, and used for phases such as handover or commissioning.
Tim Kelly, senior product manager at Autodesk explained, “We want to be able to provide an experience where we ensure the delivery of both complete and accurate as built data.
“Dashboards are our way to allow customers to dig into specific datasets and review that comprehensively. I know that when the term dashboard is used, oftentimes people refer to a Power BI or Tableau experience where you’re curating all of the data. But we have worked to pre-build some framework around this experience.”
Find this article plus many more in the July / August 2023 Edition of AEC Magazine
👉 Subscribe FREE here 👈
Dashboards are filtered views, that can be easily custom made to create specific packages of information that are relevant to a given period of time or given delivery phase, specific disciplines, specific packages, or different stages.
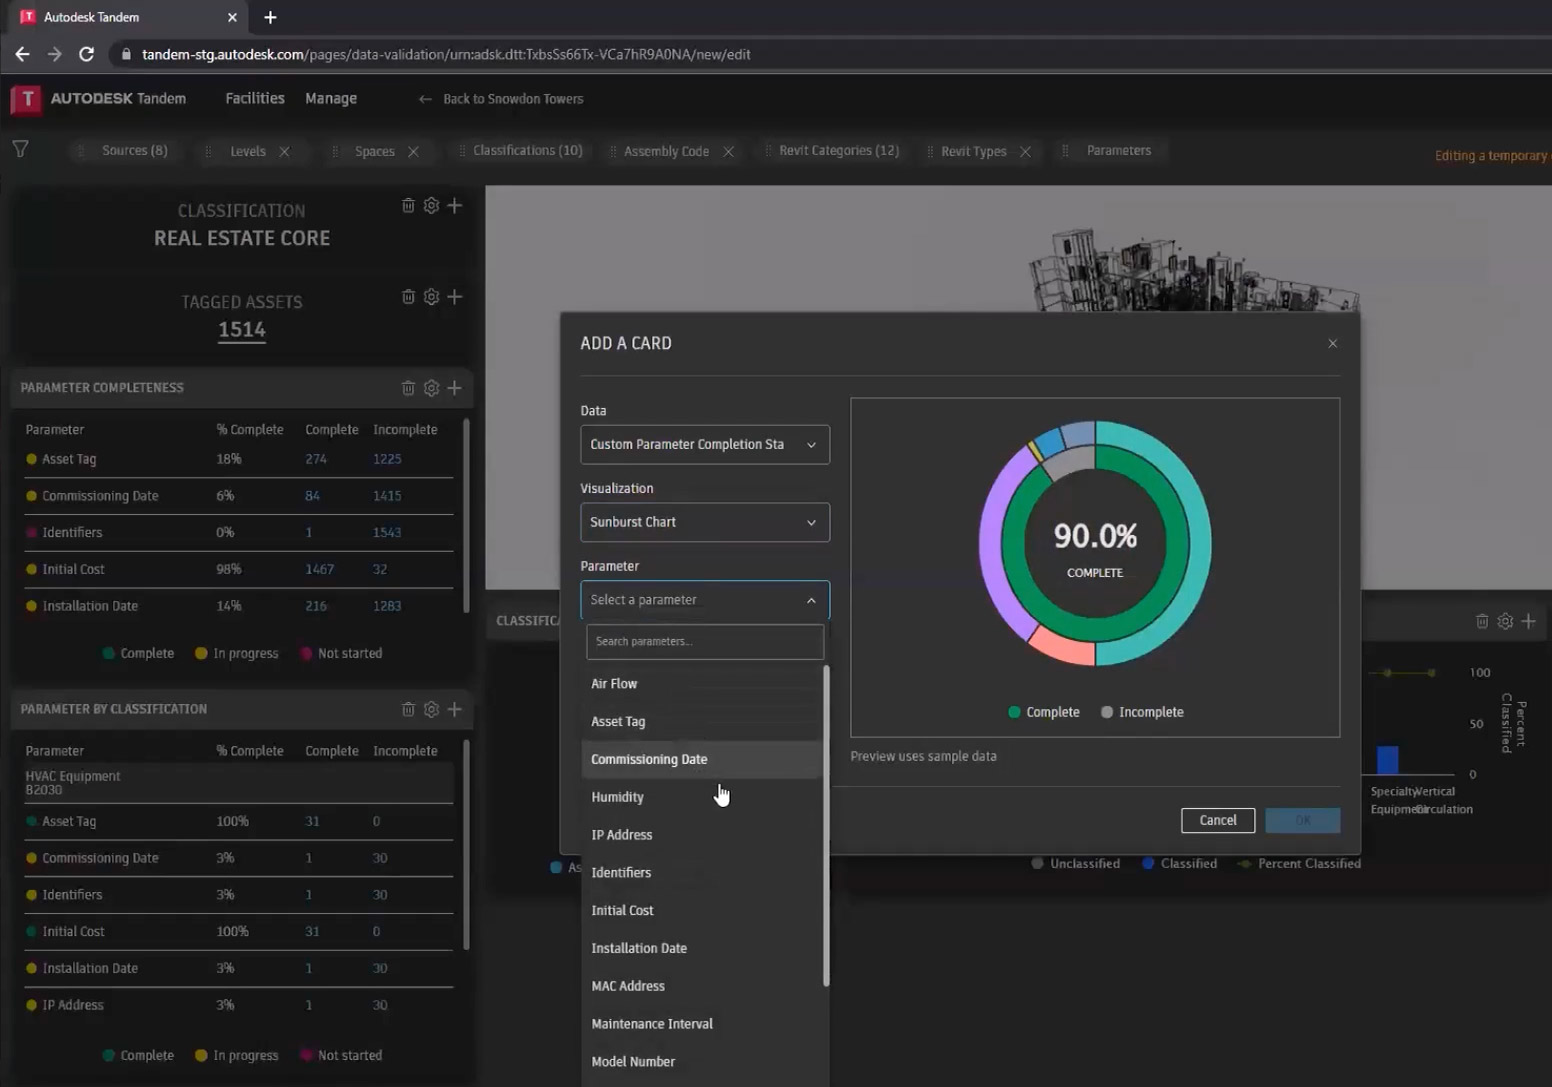
Autodesk calls each of these defined elements a ‘card’ and each has chart display options like pie, donut, or starburst. These are stored in a library, so can be inserted into the display to create views with collections of dashboard cards.
The functionality so far developed on dashboards has come from conversations with Autodesk customers who are currently having to take data out into business intelligence applications or specific dashboarding software to create external workflows.
The first function of note is a filter bar which sits across the screen to provide a view of all of the comprehensive filtering across all parameters (sources, levels, Revit categories etc.). This panel reflects everything that is in the dynamic model viewer. Users have the ability to see connected information as components are selected, allowing interaction with the different metrics that appear on screen.
If we are ever going to build solutions that can do generative design of future facilities, we need to understand how facilities operate in the real world to really impact future design decisions
Table views act as a summary of parameter completeness. Parameters are broken down by classification and are applied to different components dynamically. The lower half of the screen displays the dashboard ‘card library’, which is where users build out and track ‘completeness’ of the twin data. This can be applied across different classification levels or on specific parameters which customers want to track. Data pops up when hovering the mouse over the display cards. Some let users drill down, offering additional information on a classification level or Revit type / level etc. and the display automatically updates.
While doing that, the viewer always reflects those selections made. It’s a very interactive experience. Tandem is still a highly visual tool for dynamic display of specific datasets.
Autodesk’s focus on bringing dashboarding into its product, with this specific style of experience, is aimed at providing interactive access to data but is specifically focused on the data collection during twin building. The next phase will be to expand this experience, perhaps with more preconfigured dashboards – facility monitoring, sustainability tracking and data validation are all viable options.
From the demo, the process flow, worked thus: load a Tandem model, use the filters to select categories you are interested in checking. The display updates with the elements that fit the filter rules and the dashboard ‘cards’ dynamically change given on what’s displayed / selected. These cards are ‘percentage of name status completion’, asset’s tagged status, and model number.
Each card shows what percentage of the elements have been classified as required. If you pick all the water heaters, you see total percentage unnamed etc. You can use the filters to isolate these objects and all the tables update with feedback on the selection. Here dashboards are a tool to help navigate through and identify the outstanding components that need classification. On big jobs I can see how beneficial these tools would be.
Conclusion
To give credit where it’s due, from the complete list of AEC software tools in development at Autodesk, I think Tandem is probably the one with the highest velocity. That possibly might be because it is the newest and has the most to add. But I am impressed with the development team’s monthly reach out to engage with customer (and non-customers) to either discuss digital twin issues or demonstrate upcoming or recently introduced functionality.
I think this is a template for all software development teams but, of course, this is way harder when you have tens of thousands, to millions of users for managers of mature products.
A lot of the earlier functions were centred on the core data parsing and visualisation that is required in the creation of digital twin datasets. While dashboarding might be thought of as more of a way to display real assets status, Autodesk is again approaching this as a tool set to further identify and isolate models to easily rectify omitted data and complete the digital twin.
Making dashboards requires a lot of filtering and check box ticking, together with an inherent knowledge of the twin’s integrated systems and components. It’s the first Tandem demonstration which really made me think just how much data preparation work, filtering and tagging the digital twin process requires. And all this needs to be done before you get anything valuable out.
I couldn’t help but feel that a ChatGPT interface would go a long way to simplifying the derivation of dashboards and it’s something that Autodesk is currently looking into but there are legal issues.
As its capabilities continue to expand, Tandem’s maturing capabilities will be a challenge to keep the interface simple, hiding the complexity of the process, especially when many of those ultimately digesting the output of the system will not be digital twin experts.
Issues with digital twins
Those who understand and fully support BIM and VDC methodology are typically very supportive of digital twins and the use of them – if the data has been created in the design process and refined through to construction, especially where COBie data has also been built up for all the serviceable elements of a building. However, there is a lot more to transitioning that data into a useful environment.
The three primary challenges hindering the uptake of digital twin technology are 1) the lack of clarity on why it is better vs traditional 2D Facilities Management (FM) tools, 2) the complexity in creating detailed source data and 3) the cost associated with implementation / maintenance.
While you may think having a ‘fresh’ detailed BIM model would make the process relatively seamless and painless, BIM design and construction data is not the type of meta data the digital twin databases need.
The act of creating a digital twin requires meticulous and detailed mapping of physical assets and their data to virtual components, demanding expertise. It requires significant time, and the maintenance of this needs to be ongoing for the life of the building / asset.
It’s something that needs significant planning, resourcing, and budgeting for. The kind of costs associated with current digital twin technology mean that smaller companies, or projects, in particular, may find it challenging to allocate budgets to create and maintain digital twins of their assets.
There is also the problem with the lack of standardised frameworks and BIM’s inherent interoperability issues which multiplies as layers of data may come from other industries (oil and gas) which use diverse software and hardware systems. This presents a challenge for creating and integrating them seamlessly into one database.
Autodesk here does have the advantage of Revit supporting architecture, structural and MEP. The UK did have a five-year project running with the Centre for Digital Built Britain (CDBB) at Cambridge University, but this recently completed its five-year funding at the end of 2022 and has since and closed its doors. However, the Gemini Papers explaining the benefits of connected twin technology are still available as a useful resource.
Security is a potential issue because linking digital twins to IoT sensors means sending data from physical assets to the digital twin data model through the public internet. Organisations remain wary of entrusting critical data to this threat.
Furthermore, there is a widespread lack of awareness and understanding surrounding digital twins. Many decision-makers and industry leaders remain unfamiliar with the technology’s potential, perceiving it as an experimental venture rather than a tangible solution to real-world challenges. This lack of comprehension results in reluctance to invest in uncharted territory, slowing down adoption rates.
Why and how we are developing for digital twins?
Robert Bray, Vice President & General Manager, Autodesk Tandem
In the opening address of the recent Tandem update, Robert Bray, vice president & general manager, Autodesk Tandem, gave a great opening talk, concerning the workflow of making digital twins and offering some insight into how Autodesk is approaching the software development.
“As we think about a digital twin, there’s really two things we think about. The first is, that a twin is a digital replica of that build asset. And the important part of the replica is context- understanding of the equipment, the assets, the spaces, the systems in that facility, the interconnections between them.
“The other important aspect of the digital twin is, of course, the bi-directional connection between the physical and digital connections to all of those operational systems that give the twin the operational behavioural awareness necessary to simulate predicted informed decisions, based on real-world conditions.
“From a larger industry perspective, we really think about this, as how do we transform the asset lifecycle? That means thinking beyond what happens in design and construction, and structuring data that’s useful to an owner, beyond handover – a period in which it can be connected to existing solutions and used to build up a wealth of asset knowledge.
Why do we want to do this? Three things:
The first is to understand if the facility performs as it’s planned and designed, or not? And if not, what can we do to tune that facility to achieve its objectives? Those may be sustainability criteria, or outcomes in terms of throughput, facility, occupancy, whatever it might be.
The second is thinking about how do we detect issues and then improve that facility based on data insights? Facility management as a practice needs more data to do the job more effectively, and that means not just more data, but data that is informing those decisions, rather than just data for data to come. We need to take that data from all those operational systems and turn it into information that leads to actionable insight.
And finally, the reason we do this is to leverage that knowledge to build better in the future. If we are ever going to build solutions that can do generative design of future facilities, we need to understand how facilities operate in the real world to really impact future design decisions.
When we started this, we really bought into a maturity model around digital twins, and the purpose for this is really to start to provide a prescriptive framework for how to approach digital twins. It starts with the descriptive part, which is really that ‘as built’, what are all the assets and spaces, systems in their facility. All the metadata about them and the connections. The informative twin starts to add that operational behavioural awareness to connect some sort of physical and digital systems in that facility. This might be maintenance management systems or maintenance history, IoT sensors, building management systems, other automation systems – that type of thing – to bring that to life and provide that actionable insight.
Predictive twins then start to add ‘what if’ scenarios around looking at maintenance history of a component and predicting when it should be replaced, based on past-history of that component and failure of that component.
Comprehensive twins, starting to think about ‘what if’ simulation around what if I reconfigured this space, what’s the impact on occupant behaviour? If I upgrade the system, what’s the impact on carbon emissions and energy consumption? Autonomous twins, being the holy grail of the self-healing and self-tuning facility.
As we think about this, what’s important is we define our data standards in those early stages. Well defined Tandem models lead to downstream capabilities. If we don’t have those normalised data standards, it’s very hard to build machine logic that can lead to predictive, comprehensive, and autonomous site capabilities in the future. So really drilling in on these normalised data standards is very important.
As we think into Tandem digital twins, we think Tandem in terms of two sets of workflows. Building workflows, which is really about how do we harness all of the design and construction data, or the ‘as built’ data of that facility, to create that digital twin, complete with connections to those operational systems and data.
The second workflow is operations, how do we take that insight we’re gleaning from those that operational data and use it to inform decisions? These two things work in concert with each other. A facility is an ever-evolving thing, they’re not static, they change [every] day. We need to recognise that twins change as well, in terms of adding new workflows and capabilities. Hence, the two are interconnected.
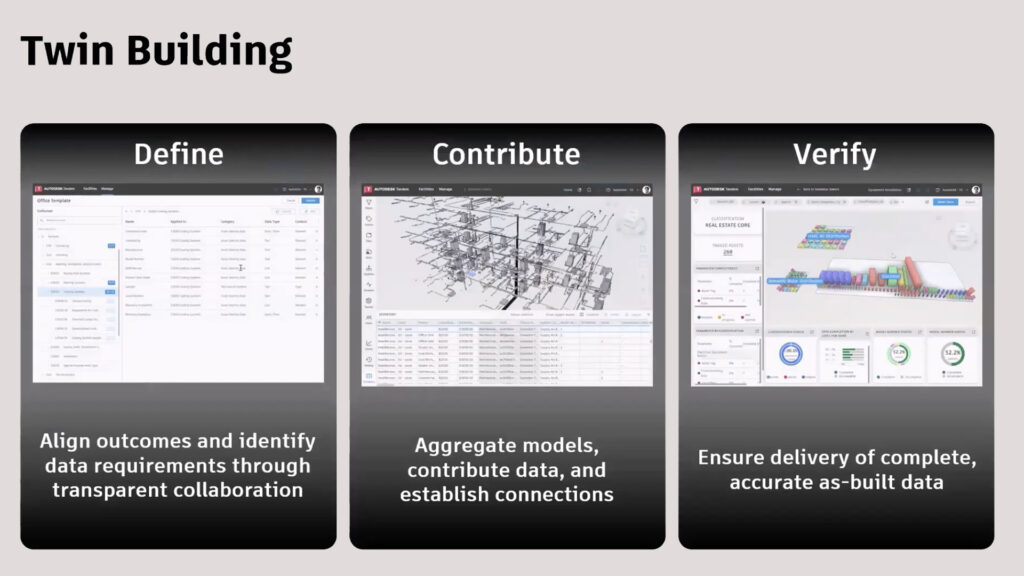
When we think about twin building, we really think about it as a three-step workflow, really defining the data requirements and the outcomes through transparent collaboration. This is really about getting those data standards well-articulated and captured for not just a facility but a portfolio of facilities. Being able to contribute all of that data from the data from submittals, from other types of documentation, maybe from as-built documentation for the facility. And the piece we’ve talked about a lot, but we haven’t shown before is the idea of who ensures complete, accurate ‘as built data’. This is what our dashboard capability is built around, really verifying completeness and accuracy.
As we talk to customers, one of the big things we hear is that we don’t trust the data we have, we need to be able to provide capabilities to ensure that completeness and accuracy of that digital twin data, to ensure it matches and reflects the ‘as-built’ facility.
Our twin building capabilities are built on a lot of the capabilities we have at Autodesk in terms of our Autodesk Construction Cloud platform, our Autodesk Docs platform, our design products like Revit, standard formats like IFC. We have AutoCAD and Navisworks in beta, but we are working towards Autodesk Build integration, we know that’s important for capturing information about things as they’re installed and commissioned on the job site. And of course, we do support that universal tool of construction, Microsoft Excel, which is often used to capture data through the construction process.
As we move downstream into operations, we think we have come up with something a little bit different. The twin building experience is clearly very much a member of the AEC-like experience, but for downstream operations. We need to provide facility managers, facility operators, an experience that is more tailored to their needs – the ability to monitor their facility through a dashboard.
We need to be able to give them the ability to drill in and investigate anomalies, again, providing more of a curated experience rather than a free-flowing 3D experience. And then, obviously, surface that information that helps them take a proactive action based on the insights they’re gaining.